How to effectively review user engagement in 2024

If you are wondering whether a brand has good marketing you only need to look at their user engagement metrics. Good metrics indicate a successful brand that knows how to capture and keep its audience's attention. Poor metrics indicate that the brand's marketing manager still doesn't have a good hold on what their audiences like and how to reach them. Luckily, both poor and good metrics can give us a better idea of what our online presence is like and how we can further improve it. So, let's take a closer look at how to properly review user engagement and use it for business improvement.
User engagement metrics
In order to effectively review user engagement, let's first outline which metrics are the most common in 2024. In essence, user engagement metrics serve to measure the level of interaction and activity users have with a product, service, or platform. The most commonly used ones are:
Active users
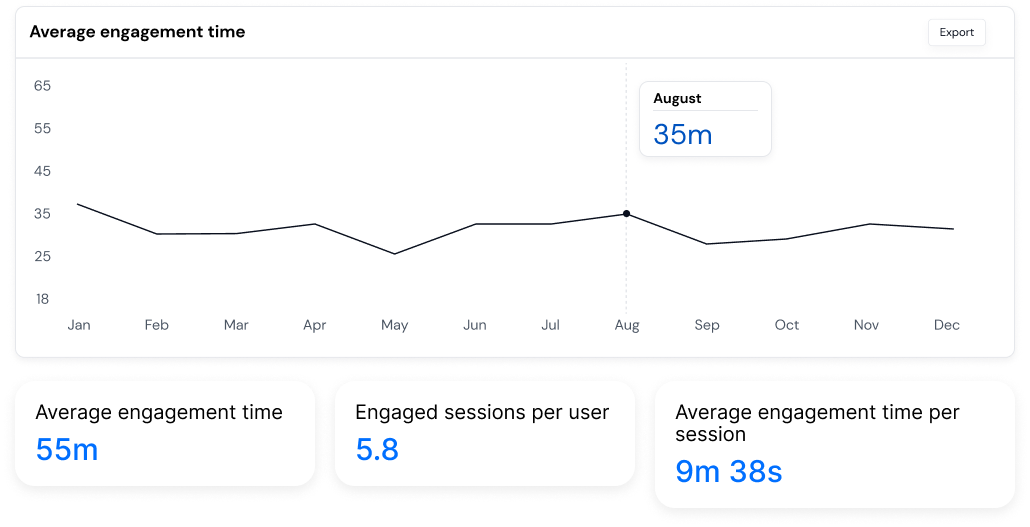
This metric outlines the number of users who engage with your product (or brand). You usually measure this within a specific time frame (daily, weekly, or monthly) depending on what you wish to know.
Session duration
With this metric, you would follow the average amount of time users spend in a single session on your app or website. Keep in mind that this metric doesn't outline how the user interacted with your brand, just that they did. If there is a specific element within your page (like a web story or a short video) viewing it won't alter the session duration. But, if the user leaves your page due to a link within a web story, the session will end. So, it is important to keep in mind what precisely session duration keeps track of.
Retention rate
One of the key traits of a successful company is being able to retain customers. As such, it is important to follow what percentage of users return to your platform over a defined period. This is what we call retention rate, and it is often measured on a weekly, monthly, or yearly basis.
Churn rate
On the other hand, we have a churn rate. This is the rate at which users stop using your product or service within a given time frame. It is usual that the lower the churn rate is, the higher the retention rate goes.
Conversion rate
In a business sense, conversion can mean a lot of things. Becoming a subscriber, buying a product, hiring a service, installing an app... These all can be instances where a potential audience member turns into an active customer. As such, the conversion rate outlines the percentage of users who took a desired action and stopped being simple audience members.
Click-through rate (CTR)
It is by no means uncommon that online content has some sort of interactive element. Even web stories are heavily focused on hosting some sort of interactivity in order to lead the audience member to further content. Ideally, every customer who views your web story will feel interested enough to check out what it refers to. Unfortunately, this is rarely the case. This is why we need to keep track of CTR. CTR is simply the ratio of users who click on a specific link or call to action. CTR can be measured on specific pieces of content, or on a larger scale.
Page views
This represents the number of times a specific page or content is viewed by users. Pretty self-explanatory. In practice, this gives you a superficial idea of how many people view your content. If your main concern is the traffic quantity, this metric will be useful. Otherwise, it only holds value when combined with other metrics.
Bounce rate
Bounce rate is one such metric. Namely, it illustrates the percentage of users who visit a single page on your website and then leave without interacting further. If you eliminate the bounce rate from your page views, you will get a rough idea of the number of visitors that find your content truly interesting.
Average session depth
Average session depth is the average number of pages or screens a user views during a single session. This encompasses whole pages or screens and doesn't give you a precise account of which page features yielded the attention.
Time spent on specific features
For those specific features, you will have to look to this metric. As the name suggests, it tracks the time users spend on particular features or sections within your page or screen. This can indicate the popularity and usefulness of those features. But, keep in mind that certain features only work well within a certain context and that removing them and placing them outside of it won't yield the same results.
Reviewing user engagement effectively
Now that we have a general idea of the important metrics, let's consider how to review them. For the purposes of the article, we'll assume that the data you've collected (be it first or third party) is trustworthy and that you've used the right analytics tools for the job. If so, here is what you ought to consider.
Outline goals
Before you review user engagement you ought to outline why you are doing so. Trying to get a better idea of where your online presence is at, and determining whether a specific piece of content is doing well are two completely different goals. And, as such, it is important to have them in mind before reviewing. As you'll soon discover, there can be numerous metrics to consider. And, it is quite easy to get sidetracked if you don't have a clear goal in mind.

With that goal, you'll need to determine the key performance indicators (KPIs). These may include any and all of the metrics outlined, depending on how you wish to look at your goal. It is vital here that you understand how specific metrics work and how they can point to one another.
Use segmentation
A good rule of thumb is to always segment your audience. Certain demographic factors can always play a role in how certain aspect of your online presence performs. Therefore, it is best that you know who you are analyst through user engagement metrics before you set out to do so. Divide your user base into segments based on different characteristics (e.g., demographics, behavior, location, engagement history, etc ). Analyzing engagement within these segments can reveal specific patterns and preferences. And can help you gain a deeper understanding of your metrics.
Analyze user journeys
Unless you are strictly analyzing user engagement for the superficial results (number of viewers for instance), you really ought to focus on user journeys. A strategic course of action is to map out the typical user journey within your product or service. Identify entry points, user flows, and drop-off points. Doing so provides numerous benefits. First, it highlights which of your metrics is the most important. Are you having trouble finding new audiences, or is the trouble in converting them? If the process of conversion is the problem, where in the user journey does the problem show? Is there a specific feature that disinterests the potential customer, or is there a problem with ease of use?
All these are important questions. And the only way to answer them is to slowly build the map of how your customers perform when doing business with your brand. After a while, you'll be able to effectively guide your users through the sales funnel, and ensure that they have a pleasurable online experience with your brand.
Use heatmaps and session recordings
If possible, you should try to use tools that provide heatmaps or session recordings to visually understand how users navigate your platform. Doing so gives you further understanding of what your users interact with, and where they encounter difficulties. In certain cases, you can only discern what the key issue is if you have a full session recording of the user journey.
A/B testing
Once you find an issue you would like to correct, it is important to encompass A/B testing. As we mentioned, most issues you'll run into are within a specific context. Therefore, it is quite hard to predict what the effect of you changing things around will be. For instance, if you feel that a specific aspect of your web story confuses or misleads your audience, you can look to alter it. But, the change you implement might perform worse than the prior version. This is why it is important to conduct A/B tests to compare different variations of your product or features. This helps in understanding which changes or optimizations lead to higher user engagement.
Compare with industry benchmarks
All industries have certain benchmarks when it comes to specific user engagement metrics. Now, does that mean that you ought to hold those benchmarks as grounded standards to adhere to? Of course not. What you ought to do is to compare your user engagement metrics with industry benchmarks or direct competitors. You need to have a clear idea of how your company compares to the ongoing industry standards, and what metrics are more important. This can provide insights into important areas where you might need to focus more.
Long-term tracking
Lastly, it is important to create regular reports to track user engagement metrics over time. Doing so will provide long-term metrics that can help you understand how your business has and likely will develop over time. These metrics are also useful to compare with the industry benchmarks as doing so gives a unique perspective into where your business stands.
Keep in mind that reviewing user engagement is an ongoing process. Therefore, it's crucial to continuously monitor, analyze, and iterate based on the insights gained to optimize user engagement and overall online presence.
Final thoughts
If you don't have much experience, we would advise that you look for a seasoned professional to help you review user engagement stats. After all, you need to have a good idea of what those stats imply, and how to best use those implications. Improving your user engagement rates is one of the most difficult jobs in marketing. And this difficulty largely lies in reading what various numbers and stats tell you. So, don't shy away from talking with more seasoned veterans and outlining a more long-term marketing plan based on adequate data.